Nine tabs off one Inputs sheet: your FIRE number, Coast and Barista FIRE, a 40-year projection, a retirement drawdown, your savings rate, and a 24-month net worth log. No email required. No sign-up. Just download and start planning.
Works in Excel, Google Sheets, and LibreOffice
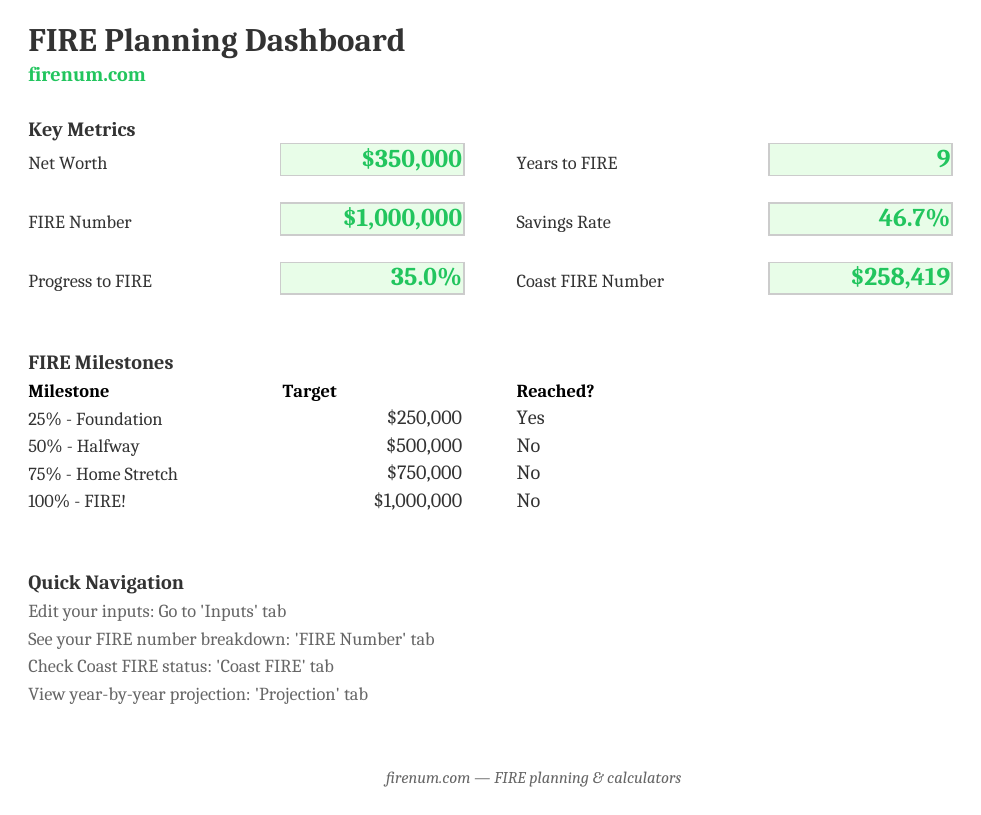
What's Included
How to Use the Workbook
Every tab uses the same cell colors: gold cells are inputs you edit, grey cells calculate, and slate values come from other tabs. You only ever type in gold cells.
1. Enter your numbers in the Inputs tab
Start here, and note that every figure is annual: income and expenses go in, and the workbook derives what you save. Add your current balances, your liabilities, your age, and your target retirement age. The Retirement Details block underneath sets what you expect to spend in retirement, any after-tax part-time income, and the age you want the money to last to. The three assumptions (expected return, inflation, and withdrawal rate) sit at the bottom of the same tab. Everything else in the workbook reads from this single source of truth.
2. Read your results on the Dashboard
The Dashboard updates instantly: net worth, FIRE number, progress percentage, years to FIRE, savings rate, your Coast and Barista FIRE numbers, and the age your portfolio lasts until, plus a milestone tracker at 25%, 50%, 75%, and 100% of your target.
3. Compare scenarios in the FIRE Number tab
Two scenario lists sit below the headline number: one moves your retirement spending to 70%, 100% and 150%, the other moves the withdrawal rate from 3% to 4.5%. Read them separately to see which lever moves your target more.
4. Check the Coast FIRE tab
It computes the amount that grows to your FIRE number by retirement with zero further contributions, using your return net of inflation. It compares that to what you have today and shows how the number shifts if you retire at 55, 60, 65, or 67.
5. Follow the 40-Year Projection
A year-by-year table and chart of your portfolio, contributions and growth in today's dollars. The horizontal line marks your FIRE number. Where the curve crosses it is your projected FIRE year.
6. Model part-time work and the drawdown
The Barista FIRE tab takes your after-tax part-time income off your retirement spending and divides what's left by your withdrawal rate, then shows how much less you need than full FIRE and what share of spending the job covers. The Retirement Drawdown tab picks up the portfolio at your retirement age, spends it to the age you plan to, and reports the age it lasts until, next to what fixed 3%, 3.5%, 4%, and 4.5% withdrawals would leave you.
7. Log your net worth monthly
The Net Worth Log holds 24 monthly rows. Type the first month and the next 23 dates fill themselves in. Once you enter a balance, the Dashboard and every other tab use your latest entry instead of the assets-minus-liabilities figure on Inputs, so your progress moves as you log.
No Macros, Pure Formulas
This workbook uses standard Excel formulas only. No macros, no VBA. That means:
- Full transparency: See exactly how every number is calculated
- Cross-platform: Works identically in Excel, Google Sheets, and LibreOffice
- Safe to use: No security warnings, no "enable macros" prompts
- Yours to change: Modify any formula to fit your situation
Default Assumptions
The workbook comes with sensible defaults that you can adjust:
- 7% annual return (historical stock market average)
- 3% inflation (typical long-term average)
- 4% safe withdrawal rate (the Trinity Study standard)
- Plan to age 95 (how long the drawdown has to last)
- $12,000 after-tax part-time income in retirement (used by the Barista FIRE tab)
All assumptions are in the Inputs tab. Change them to match your expectations.
Frequently Asked Questions
Yes. The workbook uses standard formulas only (no macros, no VBA), so it imports cleanly into Google Sheets. Upload the .xlsx to Google Drive and open it, or use File > Import inside Sheets. Formulas, conditional formatting, and the projection chart all carry over. It also works in LibreOffice Calc.
It divides your retirement spending by your withdrawal rate, which at 4% is the familiar 25x rule of thumb derived from the 4% safe withdrawal rate. The FIRE Number tab also lists your target at 70%, 100% and 150% of that spending, and again at withdrawal rates from 3% to 4.5%, so you can see how a more conservative or aggressive assumption changes it.
Yes. The Inputs tab holds every assumption: 7% annual return, 3% inflation, a 4% withdrawal rate, and the Retirement Details block that sets your retirement spending, after-tax part-time income, and the age you plan to. Change any of them and the whole workbook recalculates. Every formula is visible and editable. Nothing is locked or hidden.
Coast FIRE gives the amount that, left alone at the return net of inflation, grows to your full FIRE number by retirement with no further contributions. It shows the gap against what you hold today and the number for retiring at 55, 60, 65 or 67. Barista FIRE subtracts your after-tax part-time income from retirement spending before dividing by your withdrawal rate, so you see how much less portfolio you need and what share of spending the job covers. Retirement Drawdown runs the portfolio from your retirement age to the age you plan to, reports the age the money lasts until, and repeats the run at fixed 3%, 3.5%, 4% and 4.5% withdrawals.
No macros, no VBA, no external connections. Standard Excel formulas only. You won't see any security warnings or "enable macros" prompts, and you can inspect exactly how every number is calculated.
The spreadsheet is best for offline planning and custom tinkering: you own the file and can modify any formula. The Fire Planner runs a month-by-month simulation of your full financial picture with Monte Carlo simulation, historical backtesting, and stress testing, and saves your data locally in the browser. Many people use both: the spreadsheet for quick scenario math, the Fire Planner for the full plan.
Use the Net Worth Log tab. It holds 24 monthly rows: type the first month and the next 23 dates fill themselves in, then enter a balance whenever you check. The Dashboard and every other tab switch to your latest entry, so progress and years to FIRE move as you log. It is a quick log inside the planning file rather than a full tracker: two years is as far as it goes, and it holds one figure per month. The FIRE Tracker Spreadsheet handles multiple accounts, a longer history and charts. For automatic check-in history and reminders, the Fire Planner records balance updates over time.
Want More?
The spreadsheet is great for planning, but if you want to track your progress over time with automatic updates, try the Fire Planner, our interactive dashboard that saves your data locally and shows beautiful visualizations of your FIRE journey.
Other Free Templates
Prefer a focused sheet for one job? We also have a net-worth & progress tracker, a Coast FIRE spreadsheet, a savings-rate worksheet, a budget template, and a FIRE Backtest Spreadsheet that tests your withdrawal rate against every retirement start year since 1872. There is also the raw Shiller S&P 500 dataset if you want to back-test.
Try the Interactive Version
The Fire Planner offers the same calculations with a better interface, automatic milestone tracking, and projection charts that update as you add data.
Open Fire Planner →