Your savings rate is the single biggest lever on when you reach FIRE. This workbook turns it into numbers: years to FI at every rate, the savings you'd need to hit a target age, and what a raise or a spending cut actually buys you.
Works in Excel, Google Sheets, and LibreOffice
What's Included
How to Use the Spreadsheet
The workbook follows the standard spreadsheet color convention: blue cells are inputs you edit, black cells are formulas, and green cells highlight results.
1. Enter your numbers in the Inputs tab
Your age, monthly take-home pay, monthly expenses, current invested assets, withdrawal rate, and expected real return. The tab computes your savings rate and FIRE number automatically.
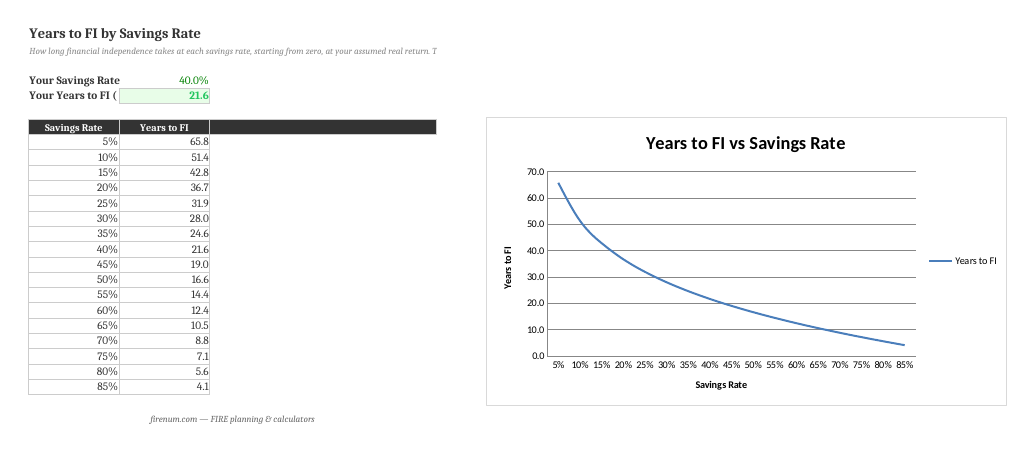
2. Find yourself on the Years to FI curve
The table and chart show how long FI takes at each savings rate. Your own rate and years are called out at the top so you can see exactly where you sit.
3. Solve for a target age
On the Required Rate tab, enter the age you want to reach FI. The spreadsheet solves for the monthly savings — and the savings rate — you'd need, given what you already have invested.
4. Test raises and cuts
The Scenarios tab compares a 10% raise, a 10% or 20% spending cut, and both, so you can see which moves your timeline most.
No Macros, Pure Formulas
Standard spreadsheet formulas only—no macros, no VBA. Full transparency, works identically in Excel, Google Sheets, and LibreOffice, and no security prompts.
Frequently Asked Questions
Your savings rate sets both how much you need (a lower spend means a smaller FIRE number) and how fast you accumulate it. Starting from zero, the math collapses to a single curve: roughly 40+ years at a 10% rate, about 25 at 30%, around 17 at 50%, and near 10 at 65%. The spreadsheet's Years to FI tab plots the whole curve and marks your own rate.
Enter a target FI age. The spreadsheet computes the years available and solves for the monthly savings you'd need—using a PMT formula that accounts for your current invested assets and expected real return—then expresses it as a required savings rate against your take-home pay.
It compares your situation today against a 10% raise, a 10% spending cut, both together, and a 20% cut—showing the new savings rate and years to FI for each. It makes the trade-off concrete: cutting spending usually moves the needle more than an equivalent raise, because it lowers the target too.
The Required Rate solver does—it factors your current invested assets into the PMT calculation. The Years to FI table is the classic "from zero" curve that isolates the effect of savings rate alone, which is why it's the clearest way to see the relationship.
Yes. It uses standard formulas only—no macros—so it imports cleanly into Google Sheets and LibreOffice. Upload the .xlsx to Google Drive and open it, or use File > Import inside Sheets.
Use a real (inflation-adjusted) return because the FIRE number is in today's dollars. The US market has returned about 7% real historically; 5–6% is a safer planning figure. You set it once on the Inputs tab and every calculation uses it.
The How Much to Save calculator gives you an instant required-contribution answer in the browser. The spreadsheet is an offline workbook you own—it adds the full years-by-savings-rate curve, a target-age solver, and raise/cut scenarios you can edit. Use whichever fits how you like to work.
Want an Instant Answer?
The How Much to Save calculator gives you the required contribution in seconds, and the Fire Planner projects your whole path with the savings rate built in.
Try the How Much to Save Calculator
Enter your target and timeline; get the exact monthly contribution — instantly, in 8 currencies.
Open How Much to Save →Looking for something else? Try the FIRE budget template to find your savings rate from a budget, or the FIRE spreadsheet for a full planning workbook.