A budget that connects to your FIRE plan. Track spending by category, and the template reads out your savings rate — then shows exactly how trimming a category lowers your FIRE number and pulls your finish line closer.
Works in Excel, Google Sheets, and LibreOffice
What's Included
How to Use the Template
The workbook follows the standard spreadsheet color convention: blue cells are inputs you edit, black cells are formulas, and green cells highlight results.
1. Enter income and assumptions
On the Inputs tab, set your monthly take-home pay, what you've already invested, your withdrawal rate, and an expected real return.
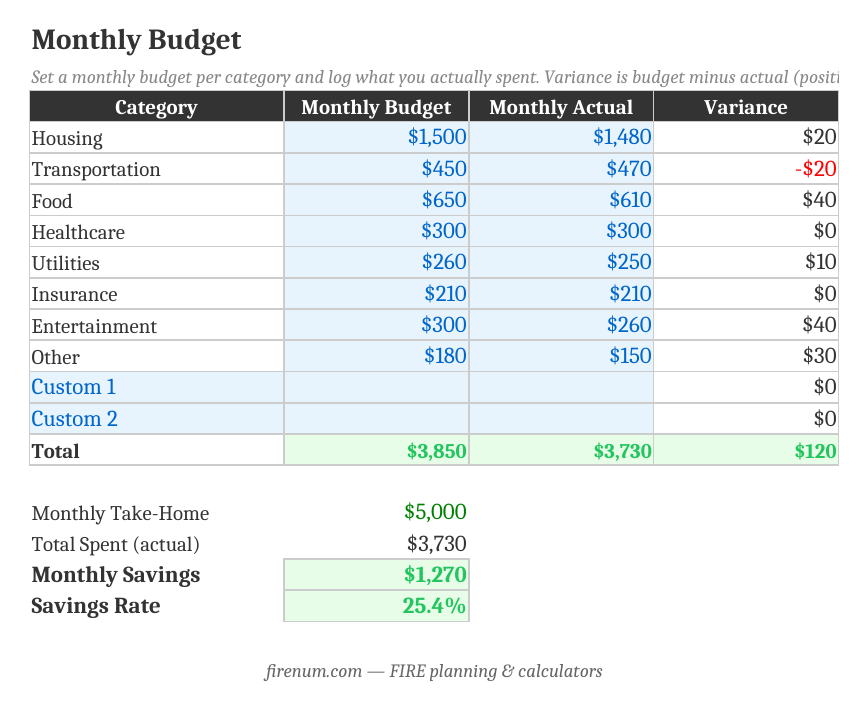
2. Fill in the Monthly Budget
Set a budget and log actual spending for each category. The template totals everything, computes your monthly savings, and shows your savings rate.
3. Read your Savings Rate and timeline
The Savings Rate tab shows your FIRE number and an estimate of years to financial independence based on your savings and current assets — plus a table of how the timeline changes at different savings rates.
4. Run the What-If
See what cutting $100 to $1,000 a month does: a lower FIRE number and an earlier finish. Small recurring cuts compound into years.
No Macros, Pure Formulas
Standard spreadsheet formulas only—no macros, no VBA. Full transparency, works identically in Excel, Google Sheets, and LibreOffice, and no security prompts.
Frequently Asked Questions
Set a monthly budget for each spending category and log what you actually spent. The template totals your spending, subtracts it from your take-home pay to get your monthly savings, and reads out your savings rate—the single biggest lever on when you reach financial independence.
The Savings Rate tab turns your actual spending into an annual figure, computes your FIRE number (25x annual spending at a 4% withdrawal rate), and estimates years to FI from your current invested assets, your annual savings, and a real return. Lower your spending and both the target and the timeline shrink.
It shows what trimming recurring spending does to your plan. Every dollar of monthly spending you cut lowers your FIRE number by 12 ÷ your withdrawal rate (300x at 4%) and adds that dollar to your monthly savings. The tab lays out $100, $250, $500, and $1,000/month cuts with the new FIRE number and new years to FI for each.
Housing, transportation, food, healthcare, utilities, insurance, entertainment, and other—the same categories the Fire Planner uses—plus two custom rows you can rename. Budget, actual, and variance columns let you see where you over- and under-spend.
Yes. It uses standard formulas only—no macros—so it imports cleanly into Google Sheets and LibreOffice. Upload the .xlsx to Google Drive and open it, or use File > Import inside Sheets.
There's no single right number, but the math is stark: at a 10% savings rate FI takes roughly 40+ years, at 50% around 17, and at 65% closer to 10. The Savings Rate tab includes a table of years-to-FI by savings rate so you can see where you land and what moving the needle does.
The template is a manual budgeting workbook you own and control. The Fire Planner models your full financial picture forward month by month—assets, debts, income, expenses, and life events—with projections and stress testing. Use the template to set and track a budget; use the Fire Planner to project the whole journey.
Want the Full Picture?
Once your budget is dialed in, the Fire Planner projects your whole path to FIRE — or start with your FIRE number to see the target your budget is working toward.
Calculate Your FIRE Number
See the target your savings rate is driving toward — instantly, in 8 currencies.
Open FIRE Number Calculator →Looking for something else? Try the FIRE tracker spreadsheet to log net worth, or the FIRE spreadsheet for a full planning workbook.