Set four inputs: starting portfolio, withdrawal rate, inflation, and retirement length. The workbook replays that plan through every start year with a full retirement of data behind it, 125 of them at 30 years, using Shiller's S&P 500 data, and counts how many ran out of money.
Works in Excel, Google Sheets, and LibreOffice
What's Included
How to Use the Spreadsheet
The workbook follows the standard spreadsheet color convention: blue cells are inputs you edit, black cells are formulas, and green cells highlight results.
1. Set the four inputs
On the Inputs tab, enter your starting portfolio, the withdrawal rate you want to test, an inflation rate for raising the withdrawal each year, and how many years of retirement to fund. Retirement length accepts 1 to 50 years.
2. Read the Results tab
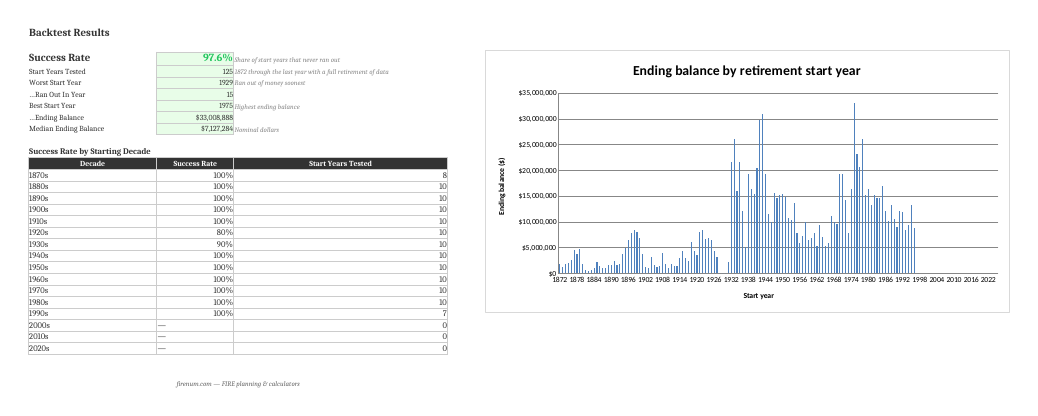
Start with the success rate and the count of start years tested. Then look at the worst start year and the year its money ran out, and at the success-by-decade table, which shows which eras were survivable and which were not. The best start year, 1975, ends at roughly $33.0M nominal; the median start year ends near $7.1M.
3. Scan the Backtest matrix for the years that hurt
Each row is one retiree. Follow a failing row across the columns to watch the balance drain year by year, and compare it with a neighboring row that made it. That is sequence-of-returns risk in one screen.
4. Change the rate and compare
Run 3.5%, then 4%, then 5%, writing the success rate down each time. At 30 years with 3% inflation, those three rates survive 123, 122, and 111 of the 125 start years.
What this backtest assumes
- 100% S&P 500 with dividends reinvested. No bonds, no international, no cash buffer.
- No fees and no taxes. A real portfolio pays both, so treat these results as a ceiling.
- Nominal returns with the flat inflation rate you type in, not measured CPI. Our Shiller dataset extract has no CPI column, and the site's own backtesting engine uses the same method.
- Shiller's prices are monthly averages of daily closes, not month-end closes.
- One withdrawal rate per run, raised each year by inflation and never cut. This is the classic 4% rule setup, not a flexible-spending strategy.
- Start years without a full retirement of data behind them are skipped, which is why a 30-year run tests 125 start years rather than all 154.
No Macros, Pure Formulas
Standard spreadsheet formulas only—no macros, no VBA. Full transparency, works identically in Excel, Google Sheets, and LibreOffice, and no security prompts.
Frequently Asked Questions
It's the share of retirement start years where the portfolio never hit zero. At 4% and 30 years the spreadsheet reports 97.6%, which is 122 of the 125 start years with a full 30 years of data behind them. The three failures all start in 1928, 1929, and 1930.
A retiree starting in 1929 took the crash in the first months and then a decade of weak nominal returns, while the withdrawal kept rising with the inflation input. At 4% on $1,000,000 that portfolio runs out in year 15. Starts in 1928 and 1930 fail too, just later.
The Shiller extract behind this workbook carries monthly total returns but no CPI column, so the spreadsheet grows each year's withdrawal by the inflation rate you type in instead of by measured CPI. The Fire Planner's backtest works the same way. The trade-off: deflationary stretches like the early 1930s look harsher than they were, and the 1970s look milder.
Yes. Change the withdrawal rate on the Inputs tab and the whole matrix recalculates, one rate per run. Over 30 years with 3% inflation: 3.5% survives 123 of 125 start years (98.4%), 4% survives 122 (97.6%), and 5% survives 111 (88.8%).
The Fire Planner runs your whole plan: several assets with their own growth rates, per-expense inflation, income streams, debts, and life events. This workbook tests one portfolio at one withdrawal rate, and every number in it is a cell you can click on and audit.
Yes. It's formulas only, no macros, so it opens in Excel, Google Sheets, and LibreOffice. Sheets takes a few seconds to recalculate the roughly 7,700 matrix cells the first time you open it.
Robert Shiller's ie_data.xls at Yale, the same file behind the site's backtesting engine: monthly S&P 500 prices with dividends reinvested, January 1872 through December 2025 in this workbook. Shiller's prices are monthly averages of daily closes, so the returns are a little smoother than close-to-close figures. The dataset page has the CSV and JSON.
Other Free Templates
The FIRE Planning Workbook covers the accumulation side and the drawdown: your FIRE number, Coast and Barista FIRE, a 40-year projection, and a year-by-year retirement drawdown. The Shiller dataset gives you the same monthly returns as CSV and JSON if you'd rather build your own model.
Want the full plan, not one portfolio?
The Fire Planner backtests your actual assets, income, and expenses month by month, with Monte Carlo and stress tests on top.
Open Fire Planner →